 BC firm's materials in space
 $10K discrimination ruling
 Quesnel pulp mill sold
 Inquiry into B.C. port strike
 Is decaf coffee bad for you?
 Ex-cop tries to quash charge
 PM pledges deportations
 Trump trial arguments begin
 Ghost guns to high court
 Nude Beverages sells line
 Wealth gap widening
 Canadian Honda EV plant
  Leafs even series
 Cristall gets pro look
 Warriors even series in OT
 Swift breaks Spotify record
 Cudi Coachella set cut short
 Bon Jovi 'hasn't been a saint'


Flood Review
-
Urban Cowboy

- Guru
- Posts: 9555
- Joined: Apr 27th, 2013, 3:47 pm
Re: Flood Review
Old Techie wrote:So all the time and money spent on this review, simply confirmed what most of us were saying last year already, before the review.
Jhunter199 wrote:alanjh595 wrote:
Too much water, too fast?
Im no flood expert, but isnt that how almost all floods manage to happen...
Too much water, too fast
It was presented as an example of the folly of wasting resources, studying something for which the conclusion is obvious.
“Not All Those Who Wander Are Lost" - Tolkien
-
Frisk

- Guru
- Posts: 9266
- Joined: Apr 24th, 2011, 9:32 am
Re: Flood Review
Greystokes snow monitor east of Kelowna shows the snow pack in that area is still growing and is near record levels (Data recorded since 1969). This area drains into Mission creek.
- Attachments
-
-
WalterWhite

- Lord of the Board
- Posts: 3838
- Joined: Jan 31st, 2017, 3:56 pm
Re: Flood Review
I think the overall premise that should be emphasized here is “be prepared”. Yes, there is record or close to record snowpacks currently in the surrounding hills that could lead to high levels of freshette, but it will all depend on the weather patterns we experience during the runoff period of now through June. We could see cool temps with minimal precipitation, or high temps with high precipitation, or any number of combinations in between - but there’s obviously no way to guarantee anything. I think the powers that be are extremely gun shy of a repeat performance of last year and are or will be taking every precaution available, but ultimately it’s up to Mother Nature, so be prepared.
-
Glacier

- The Pilgrim
- Posts: 40443
- Joined: Jul 6th, 2008, 10:41 pm
Re: Flood Review
Here is a graph showing the two highest snowpack years on record (1998/99 and 1973/74) along with the past two years.
"No one has the right to apologize for something they did not do, and no one has the right to accept an apology if the wrong was not done to them."
- Douglas Murray
- Douglas Murray
-
andrea-lake
- Newbie
- Posts: 74
- Joined: Mar 18th, 2018, 12:58 pm
Re: Flood Review
As a follow up to the excellent graph of the snowpack in Glacier's post above, the graph below shows how the lake level was managed in the spring of 1974. You can see that in anticipation of a large freshet they drew the lake down to slightly below 1.0 on the left axis (i.e., 341.25 meters).
This year the snowpack level is already larger than in 1973/74 and has a reasonable probability of exceeding the level in 1998/99. In these circumstances, the lake management rules call for a drawdown to the 1.0 level, similar to what was done in 1974. As of April 2, 2018 the lake is at 1.26 as you can see in the graph below, so we have another 26 cm to go.
The major inflow from the freshet typically starts the first week of May. However, in the past 10 days the lake has come down 6 cm, so at the current rate of outflow, it will only drop another 18 cm when we really need it to drop 26 cm. This means the rate of discharge at Penticton needs to be increased. It is currently at 49 cubic meters per second (shown in following graph as the orange line on the right axis). To achieve the goal, the discharge rate should perhaps be increased to 65 cubic meters per second.
Note: the lake management rules were posted March 31st under "Monitoring the lake level to prevent flood"
viewtopic.php?f=119&t=77601&start=15
-
the truth

- Admiral HMS Castanet
- Posts: 33556
- Joined: May 16th, 2007, 9:24 pm
Re: Flood Review
rain coming, https://www.castanet.net/weather/Kelowna snow melting, drain the swamp before we have another flood
"The further a society drifts from truth the more it will hate those who speak it." -George Orwell
-
Glacier
- The Pilgrim
- Posts: 40443
- Joined: Jul 6th, 2008, 10:41 pm
Re: Flood Review
the truth wrote:rain coming, https://www.castanet.net/weather/Kelowna snow melting, drain the swamp before we have another flood
Rain in Kelowna at these temperatures = more snow pack. If we get our rain now, and then it dries up in May, we will likely avoid flooding.
"No one has the right to apologize for something they did not do, and no one has the right to accept an apology if the wrong was not done to them."
- Douglas Murray
- Douglas Murray
-
Jflem1983

- Guru
- Posts: 5785
- Joined: Aug 23rd, 2015, 11:38 am
Re: Flood Review
Is it possible we are following the lead set by California. Deliberate mismanagement leading to seasonal states of emergency.
Sure seems that way.
Drain the swamp is rite. Start downtown
Sure seems that way.
Drain the swamp is rite. Start downtown
Now they want to take our guns away . That would be just fine. Take em away from the criminals first . Ill gladly give u mine. "Charlie Daniels"
You have got to stand for something . Or you will fall for anything "Aaron Tippin"
You have got to stand for something . Or you will fall for anything "Aaron Tippin"
-
Frisk
- Guru
- Posts: 9266
- Joined: Apr 24th, 2011, 9:32 am
Re: Flood Review
More rain and cooler temperatures forecasted, will probably fall as snow in the hills. Makes you wonder if the snow pack will reach record levels, it's getting pretty close.
- Attachments
-
-
Glacier
- The Pilgrim
- Posts: 40443
- Joined: Jul 6th, 2008, 10:41 pm
Re: Flood Review
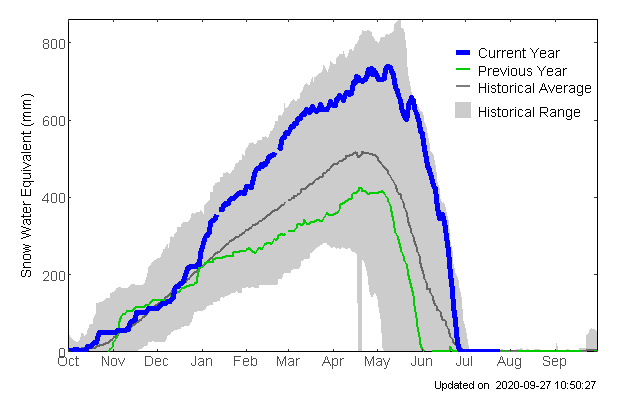
Frisk wrote:More rain and cooler temperatures forecasted, will probably fall as snow in the hills. Makes you wonder if the snow pack will reach record levels, it's getting pretty close.
Here are two different snow pillows. The first is Mission Creek (updated). The current level is the 5th highest it has EVER been there (records began in the 1960s). Only 1999, 1974, 2011, and 1972 were higher, and only 1999 was higher by this date in the year.
The second is the snow pillow in the Coast Mountains near where I used to live. It is currently the 3rd highest it has EVER been there (records began in the 1980s). Only 1991 and 2007 were higher. 1991 absolutely SHATTERS any other year because of the massive snow storm that hit in November. I remember that massive dump of snow in November of 1990 since I was living near this pillow. We had 3 to 4 feet of snow in the valley bottoms (translates into 7 to 10 feet at the snow pillow), which is double the second largest snow dump ever recorded in those parts. School was shut down for days, and they had to get bulldozers to clear the roads.
EDIT: it's interesting comparing the two pillows above. It seems that the Okanagan gets a lot more snow days, but the Chilcotin gets bigger dumps of snow when it does snow.
"No one has the right to apologize for something they did not do, and no one has the right to accept an apology if the wrong was not done to them."
- Douglas Murray
- Douglas Murray
-
andrea-lake
- Newbie
- Posts: 74
- Joined: Mar 18th, 2018, 12:58 pm
Re: Flood Review
From the graphs posted above by Glacier, there seems to be a reasonable probability of this year’s snowpack exceeding even the 1998/99 level. The best available evidence seems to suggest we will have a MAJOR FRESHET that goes well beyond the volume expected in a typical high snowpack year.
Procedures to handle such a MAJOR FRESHET were built into the 1974 lake management rules. These rules were reconfirmed in the flood review report of 1998. Both are referenced in my earlier post of March 31st under “Monitoring the lake to prevent flood”
viewtopic.php?f=119&t=77601&start=15
You can see in the chart below that in the event of a MAJOR FRESHET, the legal maximum drawdown allowed by these rules is 341.01 meters. This elevation is 24 cm lower than any of the drawdown levels mentioned in previous forum postings. Those levels were meant for a typical large freshet, not for a MAJOR FRESHET.
In previous postings of the lake level graph, the goal was a drawdown to 1.0 meters meters on the left axis. In the case of a MAJOR FRESHET as indicated in Glacier’s recent graphs, the drawdown target now becomes 0.74 on the left axis. (see graph below).
Note: to translate the numbers on the left axis above into lake elevation levels, add them to the base line elevation of 340.25 meters, i.e., 1.0 meters on the left axis translates into a lake elevation of 341.25 meters.
-
JoeS
- Newbie
- Posts: 11
- Joined: Mar 8th, 2011, 1:15 pm
Re: Flood Review
where was all this info last year?
so flooding last year and down to a puddle this year as a over reaction. really
so flooding last year and down to a puddle this year as a over reaction. really
-
normaM

- The Pilgrim
- Posts: 38136
- Joined: Sep 18th, 2007, 7:28 am
Re: Flood Review
They spend a day here ( and more to come) making the creek deeper and wider to avoid : flooding:
It did not flood last year, or any other years since they made it lower ( as far as I know from ppl lived here for years)
Or they could have removed the trees from the Creek impacting on the flow
Nope
Here for a few more days
It did not flood last year, or any other years since they made it lower ( as far as I know from ppl lived here for years)
Or they could have removed the trees from the Creek impacting on the flow
Nope
Here for a few more days
If there was a Loser contest you'd come in second
-
Jhunter199
- Fledgling
- Posts: 293
- Joined: Apr 18th, 2013, 10:11 pm
Re: Flood Review
Biggest problem I see is that there is no data on how quickly that snow pack will melt... Because no one knows, Yes there's a lot of snow in the hills, but will it flash melt or will it melt and descend at a manageable rate? The lake right now is 99cm below full pool and 34 cm lower than this date last year.
So now they are handed the issue of if the snow doesn't melt quickly everyone will complain that too much water was pulled from the lake... Lose-Lose situation.
So now they are handed the issue of if the snow doesn't melt quickly everyone will complain that too much water was pulled from the lake... Lose-Lose situation.
-
andrea-lake
- Newbie
- Posts: 74
- Joined: Mar 18th, 2018, 12:58 pm
Re: Flood Review
Re: Post by JoeS – It’s not an over-reaction to draw down the lake this year. The 1974 rules, based on historical data and reconfirmed in the 1998 flood review, reflect 80 years of actual experience. There are specific levels to which the lake is to be lowered to accommodate the amount of water expected depending on the size of the snowpack in a given year. Last year they were surprised by a late snowfall and did not have time to draw down the lake in advance. Instead, they were following the rules that apply when a drought is expected, i.e., “leave the lake as high as reasonably possible” and unfortunately the result was a major flood. In hindsight, maybe last year they should have left a wider safety margin given the uncertainties in the forecast, etc. but this year is there is no uncertainty about the very high snowpack, high ground water and more rain forecast for April. The only uncertainty is about how much larger the snowpack will get. Accordingly, the right approach is to draw down the lake to as close to the legal maximum as allowed. After it’s drawn down, the lake will not remain a “puddle” for long. It will quickly fill back up to full pool in May and June. See further detail below in my response to the post by Jhunter99. The graph below illustrates that when the lake has been drawn down to very low levels it fills back up quickly. If anything, the problem has been not drawing the lake down far enough and permitting a flood to occur.
Re: Post by Jhunter99 – I agree there is uncertainty about how quickly the upper snowpack melts and this can cause the freshet to stretch out a little longer. However, the total amount of water in the snowpack comes down regardless and is available to fill the lake back up to full pool. It really doesn’t matter whether it takes 2 months or 3 months. Given the size of the snowpack the lake will fill back up to full pool as long as they just draw it down according to the 1974 rules. If they see the snowpack melting slower than expected, they can simply slow the outflow at Penticton. That will prevent the lake from being drawn down too much before the rest of the snowpack melts and flows into the lake. This is clearly illustrated in the graphs below that shows the variation in lake levels from 1990 to 1997.
Seasonal Variation in Okanagan Lake Levels 1990-1997
Note: in 1997 the line spiked well above the top axis, indicating flooding that year. They could have avoided that flooding by following the 1974 rules and drawing the lake down 25 cm below the level they did, Similar graphs over the last 30 years show that the mistake has always been not drawing the lake down as far as the 1974 rules directed and the result was a flood in high snowpack years. This year we have an opportunity to learn from that history and avoid that result.